Quadrature Amplitude Modulation (QAM) Constellation
What is a QAM Signal Quadrature Amplitude Modulation (QAM) uses many different phases known as states: 16, 32, 64, and 256. Each state is defined by a specific amplitude and phase. This means the generation and detection of symbols is more complex than a simple phase or amplitude device. Each time the number of states per symbol is increased the total data and bandwidth increases. The modulation schemes shown occupy the same bandwidth (after filtering), but have varying efficiencies (in theory at least).
QAM — Constellation Diagrams
Constellation diagrams are used to graphically represent the
quality and distortion of a digital signal. In practice, there is
always a combination of modulation errors that may be difficult
to separate and identify, as such, it is recommended to evaluate
the measured constellation diagrams using mathematical and
statistically methods. The following section will provide application
and interpretation information of constellation diagrams of digital
modulated signals.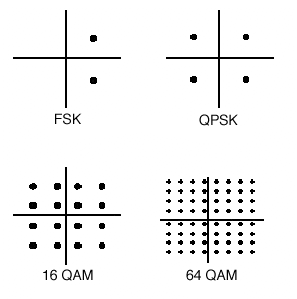
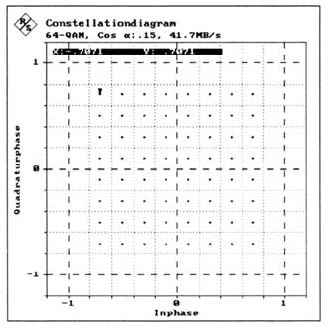
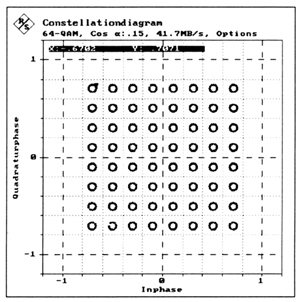
The constellation diagram examples shown are based on 64
QAM modulation and use the following basic settings: maximum
possible DVB data transmission rate of 6.92 Msps or 41.73 Mbit/s
(64 QAM); Cosine roll-off filtering with roll-off factor r = 0.15 and
PRBS (pseudo random binary sequence) data stream, no coding. Image below - Constellation Diagram for an Ideal 64 QAM Signal
Amplitude Imbalance describes the different gains of the I and
Q components of a signal. In a constellation diagram, amplitude
imbalance shows by one signal component being expanded and
the other one being compressed. This is due to the fact that the
receiver AGC makes a constant average signal level.
Phase Error is the difference between the phase angles of the I and
Q components referred to 90°. A phase error is caused by an error
of the phase shifter of the I/Q modulator. The I and Q components
are in this case not orthogonal to each other after demodulation.
Interferers are understood to be sinusoidal spurious signals
occurring in the transmission frequency range and superimposed
on the QAM signal at some point in the transmission path. After
demodulation, the interferer is contained in the baseband form of
low-frequency sinusoidal spurious signals. The frequency of these
signals corresponds to the difference between the frequency of
the original sinusoidal interference and the carrier frequency in
the RF band.
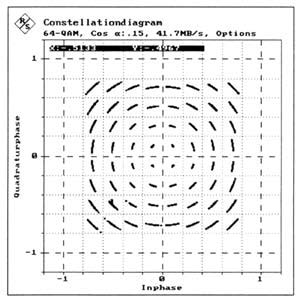
In the constellation diagram, an interferer shows in the form of a
rotating pointer superimposed on each signal status. The example
applies the condition that there is no other error present at the
same time, The constellation diagram shows the path of the
pointer as a circle around each ideal signal status. Image below - Constellation Diagram — 64 QAM signal with
Interferer (C/I = 25.0 dB)
Carrier suppression or leakage is a special type of interference
in which it’s frequency equals the carrier frequency in the RF
channel. Carrier leakage can be superimposed on the QAM signal
in the I/Q modulator. In the constellation diagram, carrier leakage
shows up as a shifting of the signal states corresponding to the
DC components of the I and Q components.
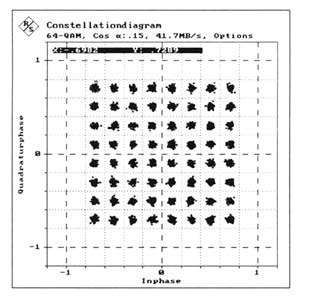
Additive Gaussian noise can disturb the digitally modulated signal
during analog transmission, for instance in the analog channel.
Additive superimposed noise normally has a constant power
density and a Gaussian amplitude distribution throughout the
bandwidth of a channel. If no other error is present at the same
time, the points representing the ideal signal status are expanded
to form circular “clouds”.Image below - Constellation Diagram — 64 QAM signal with
Additive Noise (SNR = 30.0 dB)
Phase Jitter or phase noise in the QAM signal is caused by
transponders in the transmission path or by the I/Q modulator.
It may be produced in carrier recovery, a possibility that is to be
excluded here. In contrast to the phase error described above,
phase jitter is a statistical quantity that affects the I and Q path
equally. In the constellation diagram, phase jitter shows up by the
signal states being shifted about their coordinate origin.Image below - Constellation Diagram — 64 QAM signal with
Phase Jitter (PJRMS = 1.73°)
QuestTel shall have no liability for any error or damage of any kind resulting from the use of this document.